
Chrome is the browser most developers live in, and extensions are what turn it from a preview window into a real workstation. The right ones collapse hours of repetitive inspection, testing, and debugging into single clicks.
This guide covers the essential Chrome extensions for web developers in 2026, grouped by what they actually do. All of them are free, and all the major ones have finished their move to Manifest V3, Google’s current extension standard.
A Quick Note on Manifest V3
Google completed the transition from Manifest V2 to V3, which changed how extensions handle background work and network requests. The practical effect: most developer extensions had to be rewritten, and the popular ones made the jump successfully. React DevTools, Vue DevTools, Wappalyzer, axe DevTools, and JSON Viewer all run on Manifest V3 now. If you find an old extension that stopped working, it is almost always because it never migrated.
Framework DevTools: Inspect What You Build
React Developer Tools
If you write React, this is non-negotiable. It adds a Components panel to DevTools where you can inspect the component tree, view props and state for any element, and profile render performance. Debugging a broken UI without it is like fixing a car with the hood welded shut.
Vue.js DevTools
The Vue equivalent: inspect component data, track emitted events, and browse Vuex or Pinia state in real time. If your stack is Vue, install this before anything else.
Redux DevTools
For complex state management, Redux DevTools gives you time-travel debugging: step backward and forward through actions, inspect state snapshots, and catch the exact moment things went wrong. Even if you use Zustand or another library, many support the same DevTools protocol.
Design and CSS: Match the Mockup Faster
ColorZilla
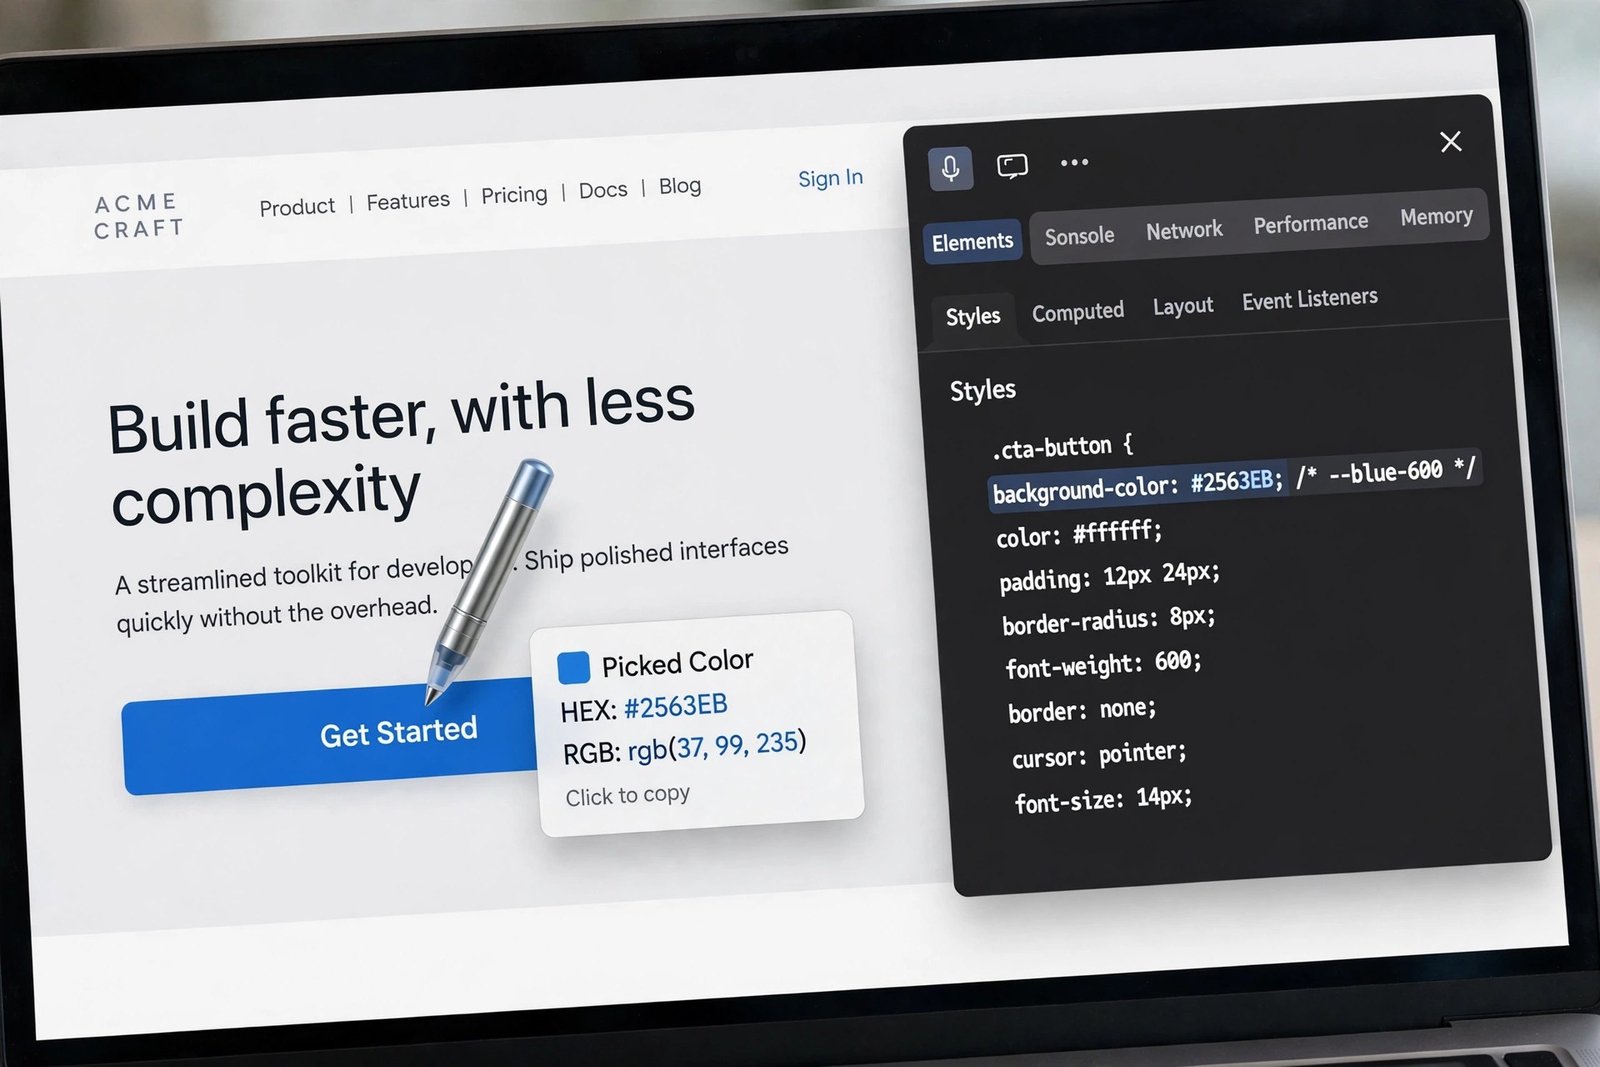
An eyedropper that grabs any color from any page, with RGB, HEX, and HSL values, a gradient generator, and a history of your recent picks. When a designer says “use that blue from the header,” this is how you get the exact value in two seconds.
WhatFont
Hover over any text and instantly see the font family, size, line height, and color. No more digging through computed styles to answer “what font is that.”
VisBug
VisBug lets you click any element and move it, resize it, or restyle it visually, right on the live page. It is perfect for experimenting with a layout tweak before committing to code. Think of it as a design tool layered on top of the browser.
API and Network: Debug the Invisible Layer
JSON Viewer
Raw JSON in the browser is a wall of text. JSON Viewer formats it into a collapsible, syntax-highlighted tree so you can search keys and scan nested responses without going cross-eyed. If you work with APIs daily, this saves more cumulative time than almost anything else on this list.
Talend API Tester
A full REST and GraphQL client inside the browser: send requests with auth headers, save collections, and add assertions. It is lighter than opening Postman for a quick endpoint check, though Postman Interceptor remains the better choice if you already live in Postman and want to capture browser traffic with cookies intact.
Wappalyzer
Click the icon on any site and see its tech stack: CMS, frameworks, analytics, hosting, even the CDN. It is useful for competitive research, debugging “how did they build that,” and vetting third-party scripts before you add them to your own project.
Performance, SEO, and Accessibility
Lighthouse
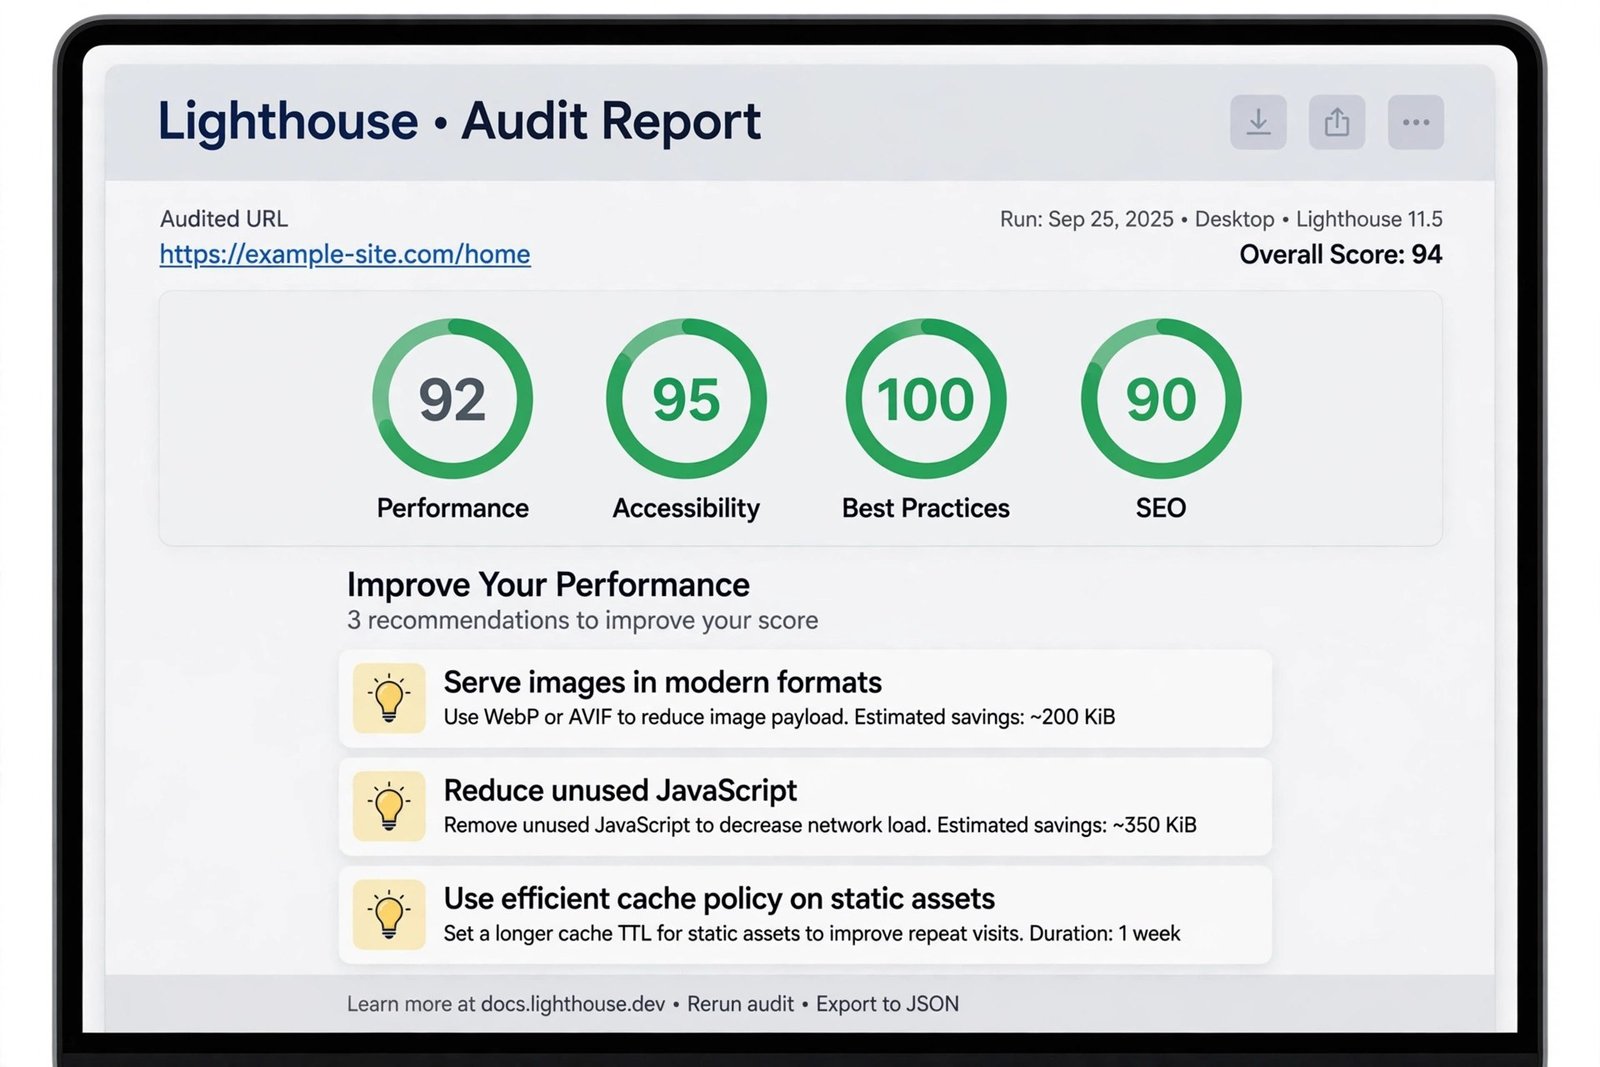
Built into Chrome but worth calling out. Lighthouse audits any page for performance, accessibility, SEO, and best practices, and hands you a scored report with specific fixes. Run it before every major deploy, not after users complain.
axe DevTools
Automated accessibility testing with clear remediation guidance. It catches missing labels, contrast failures, and keyboard traps, the issues that lawsuits and lost users are made of. Pair it with the WAVE Evaluation Tool if you want a visual overlay of problems directly on the page.
Web Vitals
Google’s Core Web Vitals extension measures loading, interactivity, and visual stability on real page loads. Since these metrics feed into search rankings, keeping an eye on them during development beats discovering a regression weeks later.
Workflow: The Quiet Productivity Wins
GoFullPage
Captures full-page screenshots as PNG or PDF in one click. Invaluable for design reviews, bug reports, and documentation. A screenshot with the exact broken state beats a paragraph of description every time.
Clear Cache
One click to wipe cache, cookies, and localStorage. When a bug “works on my machine,” stale cache is the usual suspect, and this removes the five-click trip through settings.
GitHub Helpers: Octotree and Refined GitHub
Octotree adds a file-tree sidebar to GitHub repositories, making large codebases navigable without cloning. Refined GitHub patches GitHub’s interface with better diffs, link previews, and keyboard shortcuts. If you review pull requests in the browser, install both.
The Full Toolkit at a Glance
| Category | Extensions | Core job |
| Frameworks | React DevTools, Vue DevTools, Redux DevTools | Inspect components and state |
| Design and CSS | ColorZilla, WhatFont, VisBug | Colors, fonts, visual tweaks |
| API and network | JSON Viewer, Talend API Tester, Wappalyzer | Debug responses, detect stacks |
| Quality | Lighthouse, axe DevTools, Web Vitals | Performance, a11y, SEO audits |
| Workflow | GoFullPage, Clear Cache, Octotree, Refined GitHub | Screenshots, cache, code review |
Setting Up a New Machine
On a fresh install, start with this baseline: your framework’s DevTools, JSON Viewer, Wappalyzer, ColorZilla, Lighthouse, and GoFullPage. That covers most daily work. Add the rest as you feel the friction. Fewer extensions also means a faster browser, which matters more than people admit: see our guide on fixing a slow browser if Chrome starts dragging.
Two more habits worth building. First, use Chrome profiles to separate work and personal browsing, so twenty personal tabs never slow down your dev session. Second, back up your bookmarks before experimenting with profile changes: our Chrome bookmarks export guide walks through every method. If you are setting up a full development environment from scratch, the best Linux distros for programming roundup pairs well with this toolkit.
Frequently Asked Questions
Do these extensions slow down Chrome?
Any extension adds some overhead, but the ones here are lightweight. The real slowdown comes from installing dozens you never use. Keep the list short and disable ones tied to projects you are not currently working on.
Are these free?
Yes, every extension in this guide has a free version that covers the features described. Some, like Talend API Tester and axe DevTools, offer paid tiers with team features you do not need as an individual developer.
What happened to Manifest V2 extensions?
Google phased out Manifest V2, and extensions that never migrated stopped working in current Chrome versions. The extensions listed here have all completed the move. If a favorite old tool broke, check whether its developer shipped a V3 update before hunting for a replacement.
Current roundups from Analytics Insight and the open-source Chrome Extension Booster project confirm the same core set, all Manifest V3 compatible.
Bottom Line
Install your framework DevTools, JSON Viewer, and Wappalyzer today. Add ColorZilla, Lighthouse, and a screenshot tool this week. That is a complete professional toolkit, and everything else is specialization for your particular stack.

- How to Change the Screenshot Save Location on Mac - October 24, 2026
- How to Turn Off Stage Manager on Mac - October 23, 2026
- How to Reset Your Private Space PIN on Android If You Forgot It - October 22, 2026